Network Analytics
Introduction
With the advent of segment routing (SR) technology and the development of Cisco Systems' «Jalapeño» data collection framework, there are many opportunities for application development that offer benefits to network engineers and operators. By using the network data provided by the framework, a variety of different functions and use cases can be implemented. The scope of these so-called SR apps is huge and can range from simple monitoring functions to in-depth analysis of load distribution and simulation of network changes.
This project focused on the development of an analytics application that provides information about the general state of the network and the saturation of connections in case of topology changes.
Technologies
The application is built in a monolithic architecture with ASP.Net Core. The backend is written entirely in C#, while the client-side application is implemented with JavaScript, HTML and Sass as well as vis.js as a graph visualisation library. The client-server communication is managed by the web socket library SignalR.
Features
Feature 1: Link Quality Assessment
1. Colour coding
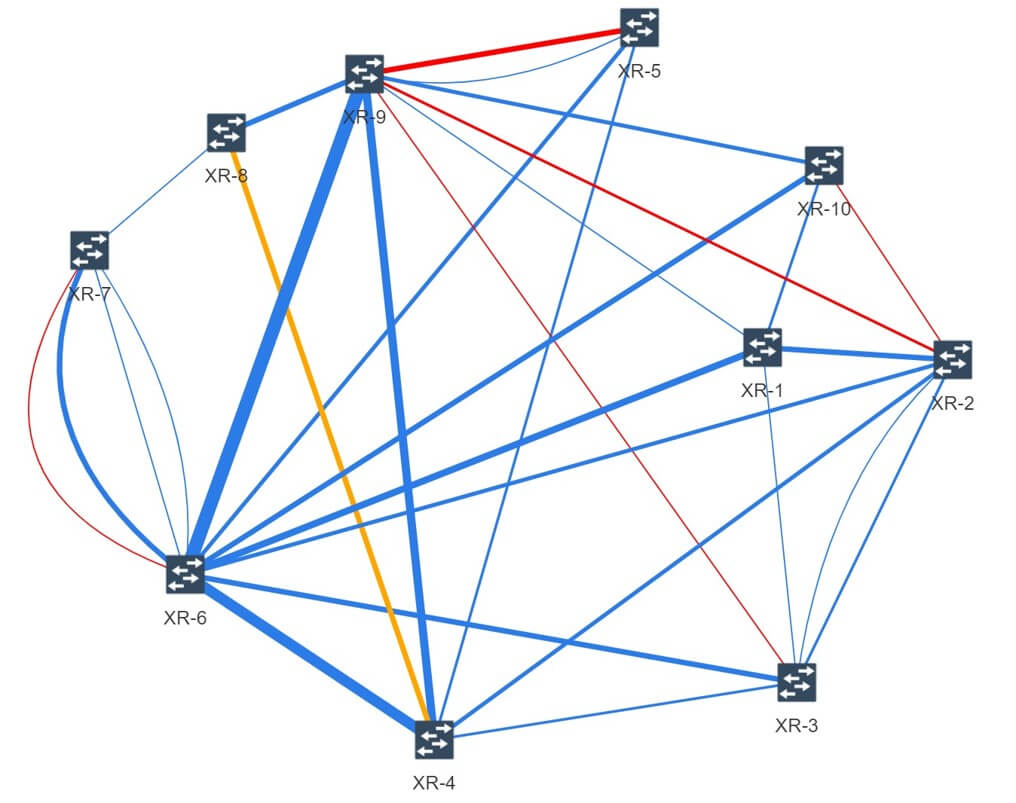
Connections are colour coded based on their quality for various metrics (such as delay, packet loss, etc.). For example:
- Blue: Low packet loss
- Orange: Medium packet loss
- Red: High packet loss
The evaluation of the connections (determining how much packet loss is to be classified as low, medium or high) is carried out using predefined threshold values.
2.Link-Thickness
The importance of a link is indicated by its thickness. The thicker the link, the more important it is. One link is considered more important than another if it is used by a larger number of shortest paths.

Feature 2: Link Saturation Prediction
The Link Saturation Prediction function allows the user to simulate changes to the topology, for example:
- Remove/Add Links
- Remove/add nodes
- Adjusting the properties of existing nodes and links
The simulation of such an event requires several steps:
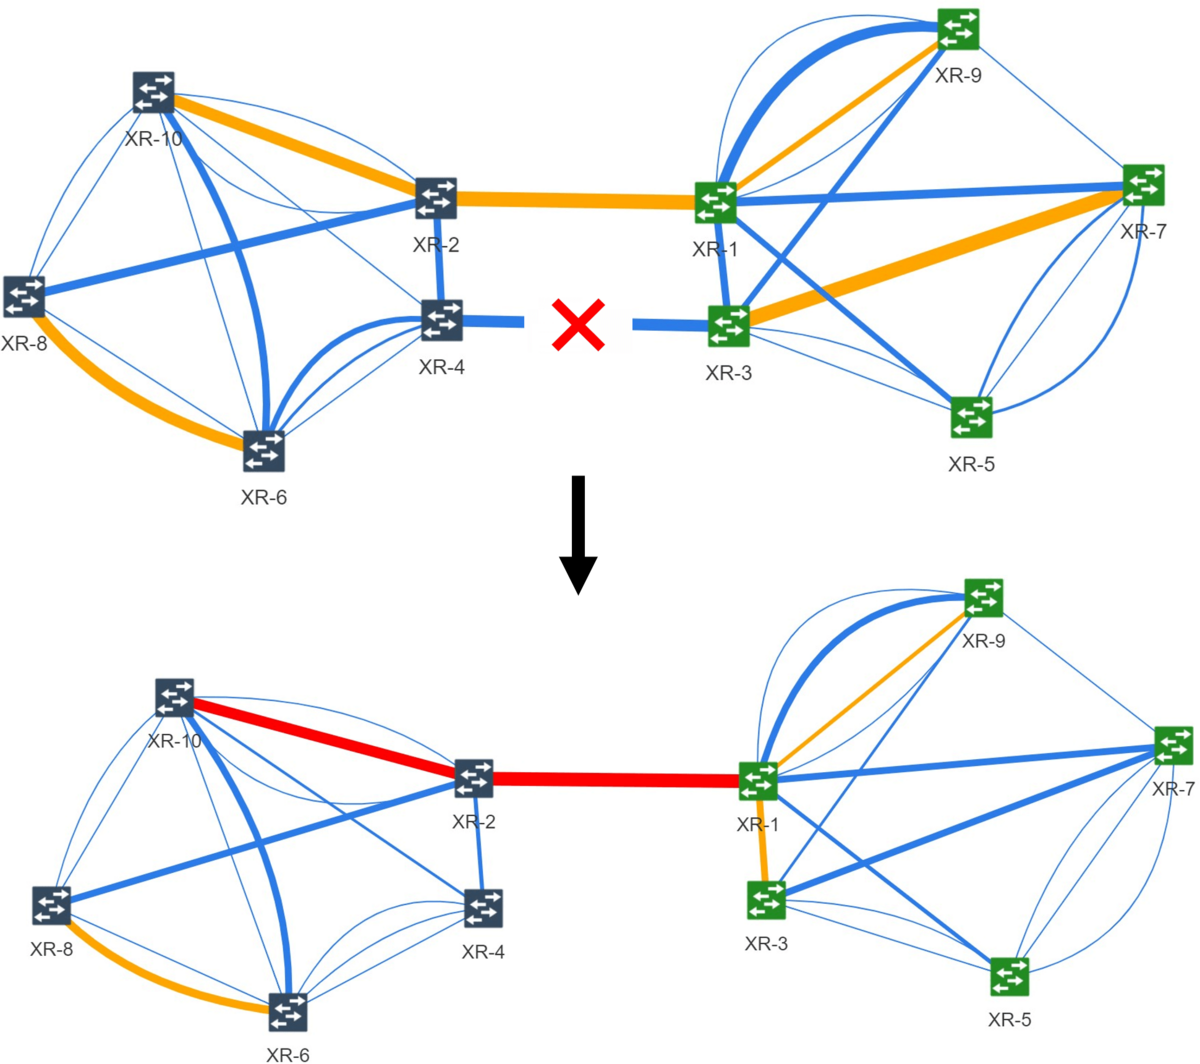
Step 1: The user receives a network map that is highlighted by the saturation of the connections (see example image).
Step 2: The user makes a change to the topology via the WebUI (in the example image a failure of a connection is simulated).
Step 3: The application recalculates all shortest paths of the entire topology, including possible multipaths with equal costs.
Step 4: The application then redistributes traffic along these paths according to the Segment Routing Traffic Matrix.
Step 5: Now that the application knows how much traffic flows through each link in the updated topology, it returns the newly highlighted network map to the user.

Performance
The computation of all shortest paths of a topology and the subsequent redistribution of traffic are very computationally intensive operations. In fact, both have a time complexity of O(n2 × log(n)). This naturally leads to a rapidly increasing computation time the larger the network is.
Nevertheless, a custom implementation of Dijkstra and an algorithm optimised for speed to redistribute traffic yielded very impressive results. Performance tests on a personal computer for a network with 1'000 nodes show that this is possible in less than two seconds with the given parameters (see the following tables).
Parameters
| Parameter | Value |
|---|---|
| Hardware | i7 6700k 4x4GHz, 32GB RAM |
| Topology | 1'000 Nodes, 3'000 Edges |
Results
| Calculation | Execution time |
|---|---|
| Calculation of all shortest paths | 0.7 Seconds |
| Redistribution of traffic | 1.0 Seconds |
Results
The resulting application combines the Link Quality Assessment and Link Saturation Prediction functions and provides a single user interface for both. It provides a visual representation of the network with all nodes (which can be clustered by region) and links. The colour coding and varying thickness of the links allow the user to assess the state of the network very quickly. Control buttons allow the user to interactively make changes to the topology and simulate their effects, e.g. simulate a link failure or draw new links.
The application is scalable for networks consisting of up to a thousand routers.


